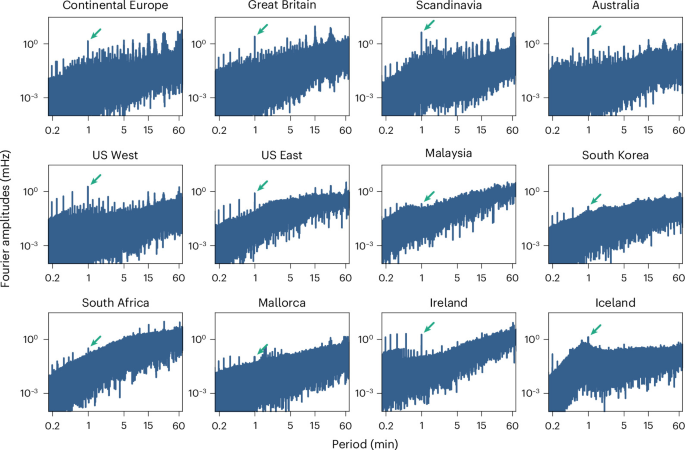
A study published in Nature Energy on October 30, 2026 identifies clock-synchronized software routines as a mechanism that can contribute to recurring one-minute disturbances in electricity-grid frequency.
Carsten Hartmann and colleagues examined frequency measurements from 12 electricity systems across five continents. They found a narrow spectral peak at a period of exactly one minute, with timing that remains coherent over long periods. The measurements span both transmission and distribution networks; their duration and sampling resolution differ between systems.
From battery checks to the transmission interface
The researchers investigated the electrical network at Forschungszentrum Jülich in Germany. Several buildings with battery-based uninterruptible power supplies (UPSs) showed a pronounced one-minute component in active-power demand.
At one installation, measurements captured recurring current peaks at the battery terminals. The manufacturer confirmed that periodic battery energy-management self-tests produced those peaks. Spectral analysis traced the corresponding power variation through transformers and a busbar to the interface with the public 110-kV network.
This is evidence of a local mechanism and its propagation into the network. It is not proof that the investigated UPS, or UPS testing alone, accounts for every one-minute frequency disturbance worldwide.
Why synchronized timing matters
A small power change at one device may have little system-level effect. Similar routines operating at aligned times across many devices can instead produce a coherent aggregate power variation.
The study examined UPS operation with network-time synchronization enabled and disabled. Its findings point to the importance of both internal scheduling and external clock synchronization. Different UPS installations showed different timing behavior, reinforcing the need to understand the particular software implementation.
A 60-second period corresponds to approximately 0.0167 Hz. That is distinct from many conventional local and inter-area electromechanical modes. The observed clock coherence also needs an explanation beyond a freely oscillating natural mode.
The grid influences the response
The resulting frequency disturbance depends on the surrounding system. Lower inertia can increase the frequency response to a given power imbalance, while hydropower turbine-governor dynamics can amplify an externally driven signal.
The authors report operational relevance, including concerns about wear in hydropower equipment. They also state that the observed signal has not reached a safety-critical level. This research does not establish an imminent blackout threat or a malicious cyberattack.
Mitigation starts with control design
The paper proposes avoiding simultaneous power adjustments through randomized scheduling, adaptive timing offsets or event-driven routines. A software update to one investigated battery block reduced strict periodicity, but the supplementary evidence describes this as partial mitigation: some timing synchronization remained.
The engineering lesson is that software timing belongs in the assessment of aggregate electrical behavior. Device-level performance alone may not reveal what a large population of similarly scheduled controllers does to the interconnected system.
Sources and related analysis
Primary source: Hartmann and colleagues, One-minute frequency disturbances from unintended synchronization in cyber–physical power systems, Nature Energy (2026), DOI: 10.1038/s41560-026-02144-0. The paper links its supplementary methods, measurements and data sources.
Featured figure: Figure 1 from Hartmann and colleagues (2026), showing measured frequency spectra for 12 grids. Reproduced without alteration under CC BY 4.0. View the original figure and caption.
Related Grid Perspective analysis: The Return of Oscillations; From Rotating Machines to Digital Controllers; The New Oscillation Modes Nobody Designed For; and The Power Electronics Supercycle.