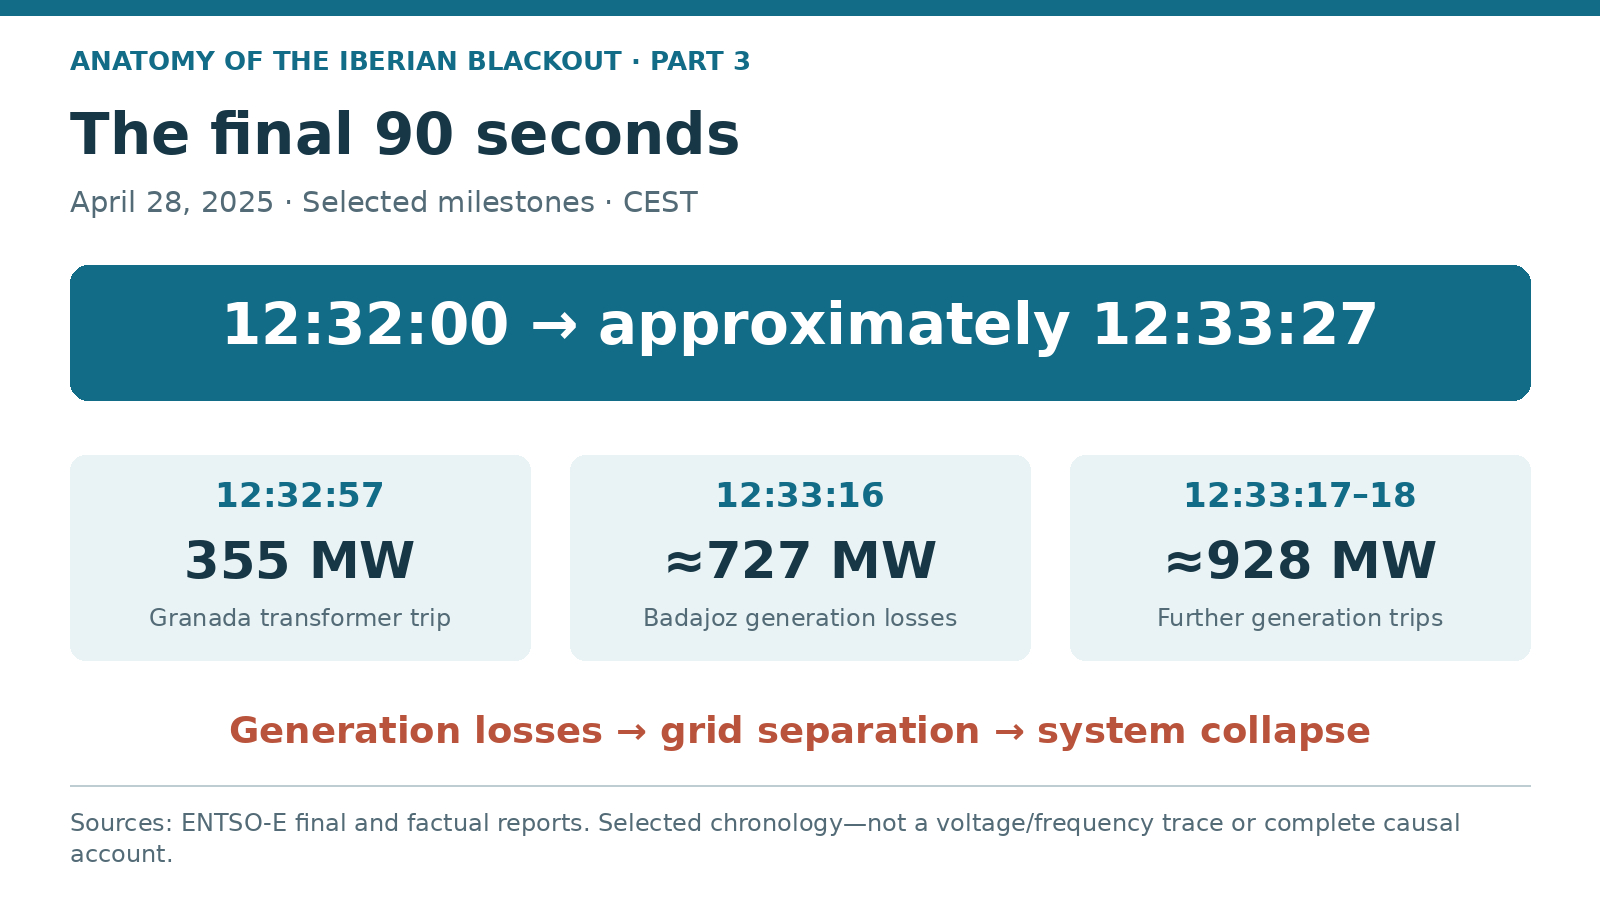
Selected ENTSO-E chronology, April 28, 2025, CEST; not a measured voltage or frequency trace.
At 12:32 p.m. on April 28, 2025, the electricity systems of Spain and Portugal were still operating as part of Continental Europe’s interconnected grid.
Less than 90 seconds later, mainland Spain and Portugal were experiencing a widespread blackout.
The collapse was extraordinary for its speed.
Generation output fell in successive waves. Some generating facilities disconnected, while others experienced rapid reductions in output. Transmission voltages rose sharply. Frequency began to fall. Automatic protection and emergency defence systems operated, but the disturbance continued to accelerate.
Finally, the Iberian system lost synchronism with Continental Europe, and its remaining international electrical connections were interrupted.
The European Network of Transmission System Operators for Electricity (ENTSO-E) subsequently reconstructed the sequence using measurements and event records from transmission-system operators, generating facilities, substations and phasor measurement units.
Its investigation reveals a cascading failure in which voltage instability, generation losses and frequency deterioration reinforced one another.
Understanding the final 90 seconds requires following those processes separately—and then examining how they interacted.
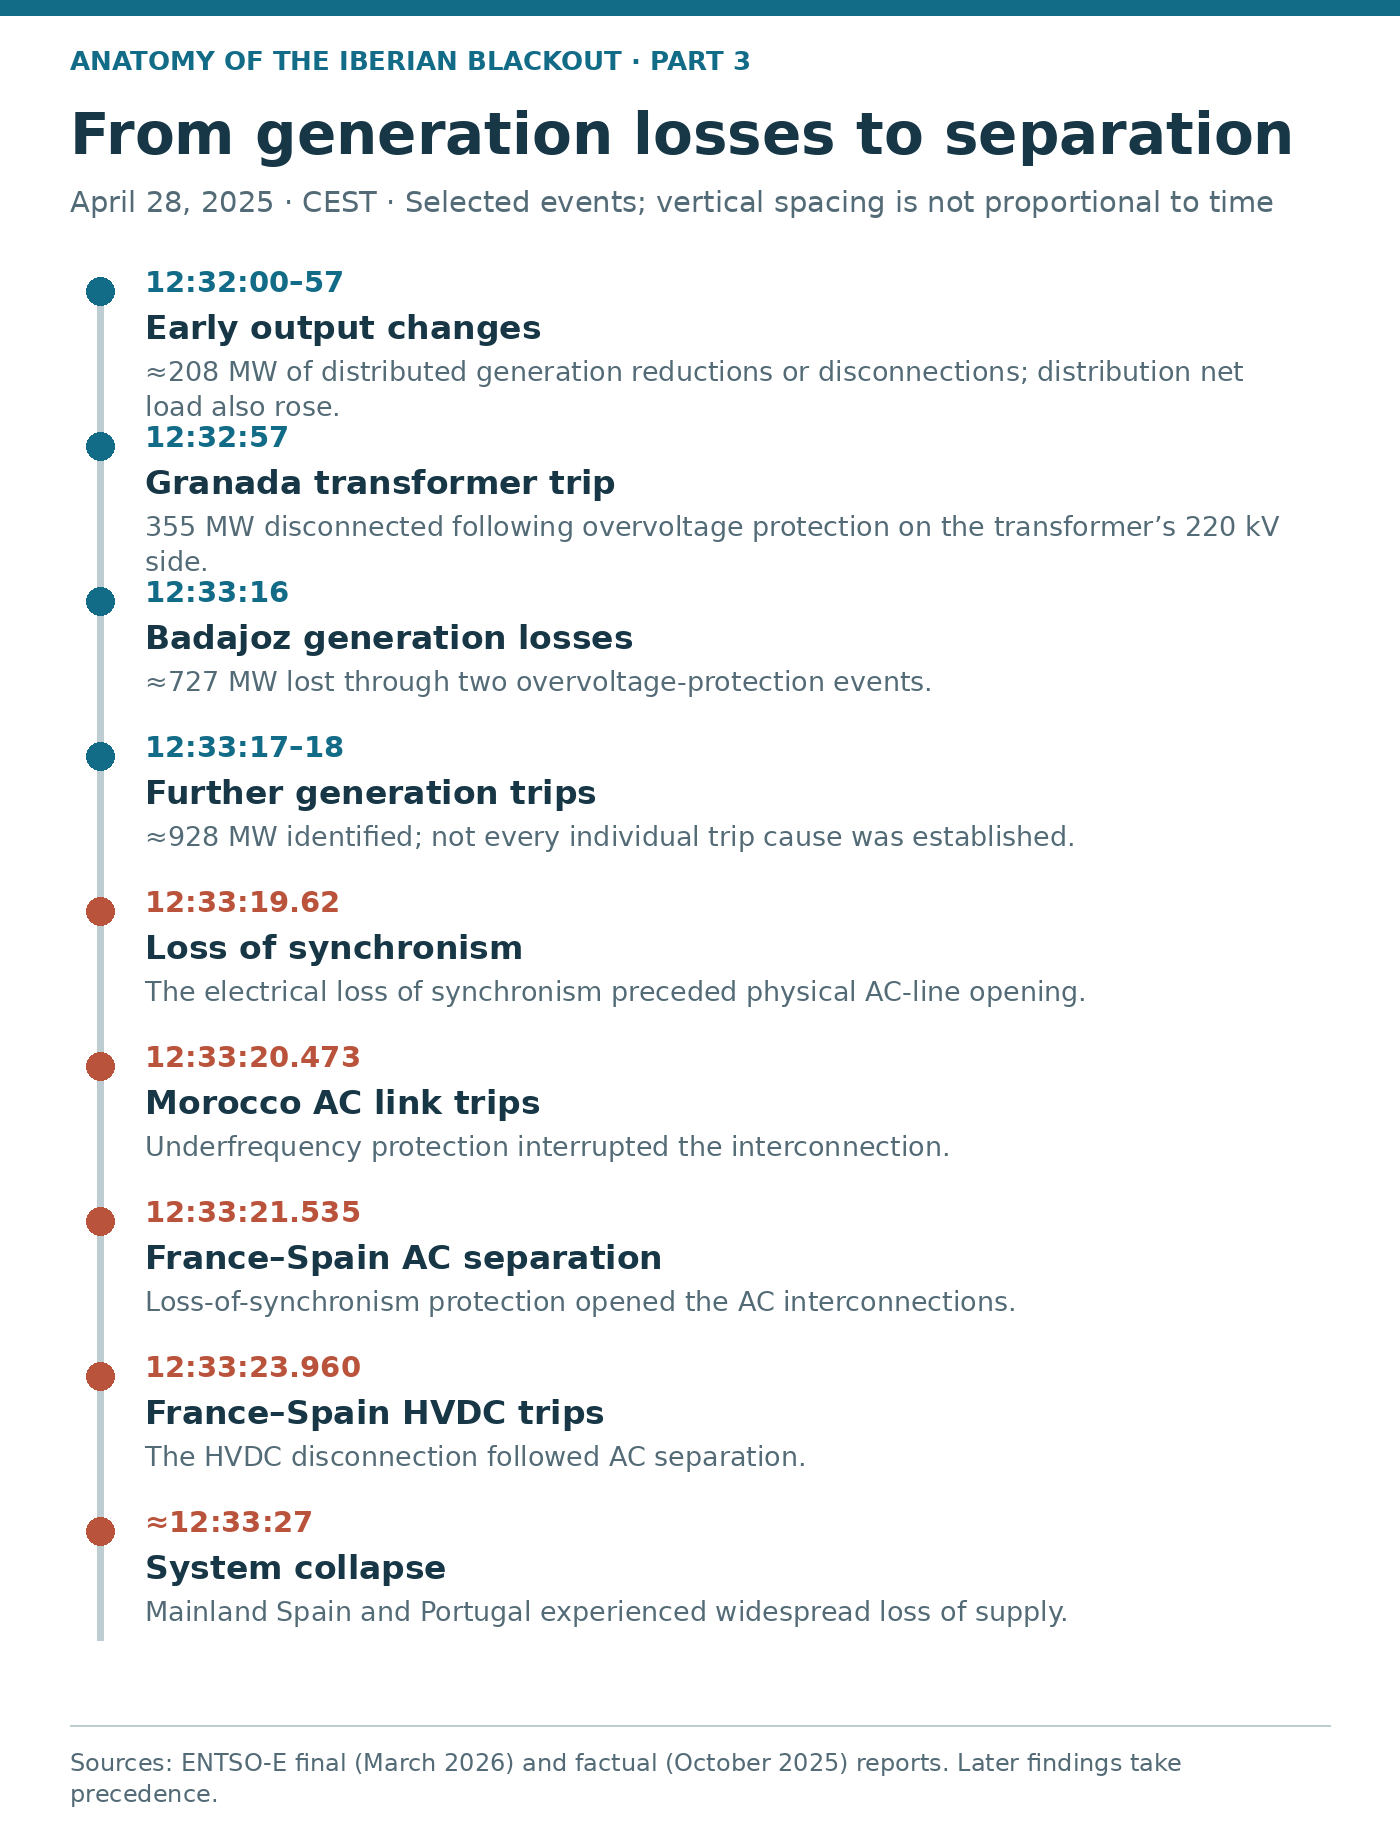
1. The System at 12:32
The half hour preceding the collapse had included two periods of power-system oscillations.
The first occurred around 12:03–12:08, and the second around 12:19–12:22.
Operators had taken measures to damp the oscillations, including changes affecting cross-border power transfers and network operation.
Those measures reduced the oscillatory behavior but also influenced transmission voltages.
By 12:32, the earlier notable oscillations had subsided.
ENTSO-E’s factual report stated that measured voltages at the Iberian 400 kV level were below 420 kV at the start of the incident window.
The system was therefore not already experiencing the final uncontrolled voltage escalation.
But the operating conditions that preceded the cascade were significant.
The grid had shortcomings in effective voltage regulation that would become critical as the disturbance developed.
2. The First Minute: 12:32:00–12:32:57
The initial deterioration was not a single dramatic equipment failure.
Instead, ENTSO-E identified several changes affecting generation and net demand.
Between 12:32:00 and 12:32:57, ENTSO-E’s final report identified approximately 208 MW of reductions associated with distributed wind and solar generating units in northern and southern Spain.
These involved either rapid downward changes in operating point or disconnections, with the reasons for some events unresolved.
The distinction matters. A reduction in a generating unit’s output does not necessarily mean that its electrical connection to the network has opened.
During the same period, net load measured in distribution networks increased by approximately 317 MW.
The October 2025 factual report left the composition of that increase unresolved.
The March 2026 final report provided a more specific assessment: the increase was attributed partly to disconnections of small embedded generating units and partly to increased voltage-dependent load as voltage rose, while uncertainty remained about some individual events.
Measured distribution net load represents the difference between demand and generation within the observed distribution network.
An increase in that quantity does not necessarily mean that consumers deliberately switched on an equivalent amount of additional electrical load.
It can also reflect reduced embedded generation or a change in the electrical power absorbed by voltage-dependent loads.
Together, the generation-output changes and the increase in measured net demand represented a deterioration in the system’s active-power balance before the larger transmission-connected generation trips.
3. 12:32:57 — A Transformer Trips in Granada
The next major event occurred shortly after 12:32:57.
A generation transformer in the Granada region disconnected following operation of overvoltage protection on the 220 kV side of a 400/220 kV transformer.
The transformer connected several generating facilities to the transmission network, including photovoltaic, wind and solar-thermal resources.
At the time of disconnection, approximately 355 MW of generation was being injected through the transformer.
ENTSO-E reported that the voltage at the 400 kV level was approximately 417.9 kV at the time of this event.
This is a technically important distinction.
The reported protection operation occurred on the 220 kV side. The measured voltage at the 400 kV level must not be treated as the direct pickup voltage of the protection device.
The transformer trip removed generation from the network and contributed to the developing disturbance.
It also demonstrated how a protection action affecting a common connection point could disconnect multiple generating facilities.
4. 12:33:16 — Additional Generation Losses in Badajoz
For several seconds, the disturbance continued developing.
Then, at approximately 12:33:16, two groups of generation trips occurred in the Badajoz area.
ENTSO-E’s March 2026 final report identified approximately 727 MW of photovoltaic and solar-thermal generation lost through these events.
The first evacuation line tripped at 12:33:16.443 through overvoltage protection.
A second event occurred at 12:33:16.820, also through overvoltage protection.
These findings update the October 2025 factual report, which used an approximately 725 MW estimate and did not establish the same degree of certainty about both protection operations.
The earlier factual report also described a voltage measurement of approximately 435.4 kV from a nearby Cáceres phasor measurement unit.
That reading already reflected changes associated with generation loss. It was not a direct measurement of the protection pickup voltage at the Badajoz connection point.
The voltage measurement therefore should not be interpreted as proof of the precise voltage threshold at which either evacuation line disconnected.
What is established is that substantial additional generation disconnected during worsening voltage conditions.
The resulting loss of active power contributed to the decline in system frequency.
5. 12:33:17–12:33:18 — The Cascade Accelerates
Within approximately another second, further generation disconnections occurred in several Spanish regions.
ENTSO-E identified losses involving wind and solar generation in Segovia, Huelva, Badajoz, Sevilla and Cáceres.
The March 2026 final report identified approximately 928 MW of generation disconnections in this interval.
The October 2025 factual report had described approximately 930 MW of measured losses and discussed a frequency-based estimate of up to approximately 1,100 MW.
The final report’s identified quantity is used here for the event reconstruction.
The earlier estimate illustrates uncertainty in reconstructing rapidly developing generation losses from different measurements; it is not evidence that the actual loss exceeded 1,100 MW.
Some disconnections were associated with overvoltage protection.
For other individual facilities, the available investigation findings did not establish every specific cause.
By this point, the accumulating generation losses had become substantial.
The system was no longer responding to an isolated disturbance.
It was experiencing a sequence in which successive disconnections altered the electrical conditions encountered by the remaining connected resources.
6. The Voltage Escalation
One of the most important features of the blackout was the relationship between generation disconnections and reactive-power balance.
Some of the generating units that disconnected had been absorbing reactive power.
Reactive-power absorption can help restrain high transmission voltages.
When those units disconnected, their contribution to voltage reduction disappeared.
Unless other resources could compensate sufficiently and quickly, voltage would rise further.
ENTSO-E documented this interaction as part of the developing cascade.
The October 2025 factual report recorded maximum monitored 400 kV network voltages of approximately 442.5 kV at 12:33:17 and 451.4 kV at 12:33:18.
These figures represent measured maxima across the monitored network at the specified times.
They should not be interpreted as a continuous voltage trace from a single substation or as protection pickup settings.
The voltage escalation was especially pronounced in southern Spain.
The disturbance also affected voltage conditions in Portugal.
This sequence illustrates a dangerous form of positive feedback.
Generation disconnections remove reactive-power absorption.
Voltage rises.
Additional generating facilities disconnect.
Further reactive-power absorption is lost.
The resulting instability can develop faster than manually operated equipment or slower generation redispatch can respond.
7. Why Frequency Began to Collapse
The blackout involved both voltage and frequency instability, but they did not play identical roles.
Voltage instability was central to the generation-disconnection cascade.
Frequency deterioration reflected the growing active-power imbalance as generating facilities disconnected or reduced output.
Before the incident, system frequency had been close to the nominal 50 Hz.
ENTSO-E’s factual reconstruction reported that frequency declined to approximately 49.94 Hz following the 355 MW disconnection at 12:32:57.
After the subsequent Badajoz generation losses around 12:33:16, frequency fell to approximately 49.9 Hz.
Following further losses around 12:33:17, frequency declined toward 49.8 Hz.
As the cascade accelerated, the imbalance became much larger.
ENTSO-E’s factual analysis reported additional generation disconnections before 12:33:20 and a rapid frequency decline toward approximately 48.5 Hz.
These frequency observations help explain the increasing severity of the active-power imbalance.
They should not be treated as an independent measurement of the precise output lost at every individual facility.
At this stage, the system was experiencing a severe disturbance involving both voltage and frequency.
The two mechanisms were interacting.
But the engineering distinction remains important: the falling frequency should not be mistaken for evidence that the original cascade began as a conventional generation-shortage event.
8. 12:33:19 — Iberia Begins Losing Synchronism
An interconnected alternating-current power system depends on the ability of its connected regions to remain synchronized.
During normal operation, generators and interconnected areas maintain a common electrical frequency, with angular differences that support the transfer of power.
Severe disturbances can cause those angular relationships to become unstable.
ENTSO-E’s factual analysis placed the loss of synchronism between the Iberian Peninsula and Continental Europe at approximately 12:33:19.62.
This occurred before the France–Spain alternating-current interconnections physically disconnected.
That sequence is significant.
Loss of synchronism is an electrical stability condition.
The subsequent opening of interconnection circuits is a protection action responding to that condition.
The two should not be treated as the same event.
Large power swings developed across the France–Spain AC interconnections as the electrical systems moved out of synchronism.
The interconnected grid was now approaching physical separation.
9. Automatic Defence Systems Operate
Between approximately 12:33:19 and 12:33:22, automatic load-shedding and system-defence schemes operated in Spain and Portugal.
These schemes are designed to respond rapidly to severe disturbances.
Underfrequency load shedding, for example, disconnects selected electrical demand to help restore the balance between generation and consumption.
Such schemes are essential elements of power-system emergency defence.
However, they cannot be assumed to arrest every type of instability.
In the Iberian blackout, the disturbance involved rapidly escalating voltage problems, extensive generation disconnections and the loss of synchronism.
ENTSO-E reported that the automatic defence actions were unable to prevent the collapse.
The event demonstrates why emergency schemes must be evaluated against a range of interacting failure mechanisms rather than a single assumed disturbance.
10. 12:33:20 — The Morocco Interconnection Disconnects
At 12:33:20.473, the alternating-current interconnection between Spain and Morocco disconnected.
ENTSO-E attributed the trip to underfrequency.
This removed another international electrical connection during the rapidly developing disturbance.
The disconnection was part of the documented sequence of protection actions as the Iberian system deteriorated.
It should not be interpreted as the initiating cause of the blackout.
11. 12:33:21 — Separation From Continental Europe
At 12:33:21.535, the AC overhead interconnections between France and Spain disconnected through loss-of-synchronism protection.
The protection action separated the Iberian AC system from the wider Continental European synchronous area.
The disturbance had now progressed beyond generation disconnections and voltage escalation.
The system’s international synchronous connection had been lost.
This separation also limited the propagation of the instability into the wider European system.
However, the Iberian Peninsula was left facing an extreme internal electrical imbalance.
The AC separation did not by itself restore stability.
12. 12:33:23 — The HVDC Link Trips
The France–Spain high-voltage direct-current interconnection remained electrically distinct from the AC transmission connections.
Unlike an AC line, an HVDC link transfers power through converter stations and does not require the two connected AC systems to operate in synchronism.
That capability can be valuable during disturbances.
However, HVDC links also have operating limits and protection systems.
ENTSO-E’s factual report recorded the France–Spain HVDC interconnection disconnecting at approximately 12:33:23.960.
This completed the electrical separation of the Iberian Peninsula from France.
The disconnection occurred after the loss of synchronism and AC interconnection separation.
It was not the initial event that produced the cascade.
13. Approximately 12:33:27 — System Collapse
By approximately 12:33:27, the Iberian power system had reached the final stage of collapse.
In less than 90 seconds from the beginning of the incident window, a functioning interconnected electricity system had experienced extensive generation-output reductions and disconnections, uncontrolled voltage escalation, severe frequency deterioration and the loss of its international electrical connections.
The speed of the sequence left little opportunity for interventions requiring manual decisions or slow equipment response.
Automatic controls and protection systems operated, but they were unable to contain the developing disturbance.
The blackout affected mainland Spain and Portugal on an extraordinary scale.
14. Why the Protection Systems Could Not Save the Grid
It is tempting to interpret a cascading blackout as evidence that protection systems simply failed to operate.
The Iberian event presents a more complicated picture.
Many protection systems did operate.
A transformer disconnected following overvoltage protection operation.
Two Badajoz-area evacuation-line events were identified in the final investigation as overvoltage-protection trips.
Other generating facilities disconnected during rapidly rising voltage conditions, although not every individual trip cause was established.
International interconnections opened in response to underfrequency or loss of synchronism.
Automatic system-defence schemes also activated.
The central problem was that individual protective actions could not preserve the stability of the interconnected system.
A protection system may correctly prevent damage to a local asset while its disconnection changes the operating conditions for the remaining network.
If many devices respond during the same disturbance, their combined effect can be destabilizing.
This is one reason that system-wide protection coordination is especially important in networks with diverse generation technologies and rapidly changing electrical conditions.
The correct engineering response is not to assume that protection should simply be disabled.
It is to ensure that protection settings, equipment capability, ride-through requirements, dynamic voltage controls and emergency defence schemes are coordinated across the interconnected system.
15. What the Final 90 Seconds Reveal
The Iberian blackout demonstrates several fundamental principles of power-system engineering.
First, a voltage disturbance can become a system-wide active-power problem.
As generation disconnects or reduces output, frequency can deteriorate even when the initiating instability is voltage-related.
Second, reactive-power behavior matters during cascading disturbances.
The loss of equipment absorbing reactive power can increase voltage and contribute to additional disconnections.
Third, local protection and system-level stability must be coordinated.
Individual protective actions can be technically justified while their combined consequences become dangerous.
Fourth, the speed of the disturbance determines which corrective resources remain useful.
A control action requiring minutes cannot reliably stop a cascade developing in seconds.
Fifth, international interconnections are not unlimited safeguards.
Their contribution depends on operating conditions, stability limits and protection requirements.
Finally, the event shows why high-resolution measurements are essential.
Without synchronized disturbance recordings, phasor measurements and detailed equipment event logs, reconstructing the sequence would be substantially more difficult.
16. The Question That Follows
The final 90 seconds reveal how the Iberian system collapsed.
But they do not, by themselves, explain every operational decision made before the disturbance.
Why were particular voltage-control resources scheduled?
What information did operators have as voltage variability increased?
How were the oscillations interpreted?
What corrective measures were available, and how quickly could they act?
Those questions require examination of the operating decisions, procedures, equipment capabilities and constraints that preceded the cascade.
They are the focus of the next installment.
Next in the series:
Part 4 — Inside the Control Room: Operator Decisions Before and During the Collapse
An engineering investigation into the information available to operators, the measures taken to manage oscillations and voltage, and the operational constraints that shaped the response.
Source note: ENTSO-E final investigation · ENTSO-E factual report · Final-report announcement · Initial statement — historical comparison.
Previous: Part 2 — The Grid Before the Blackout · Explore the series